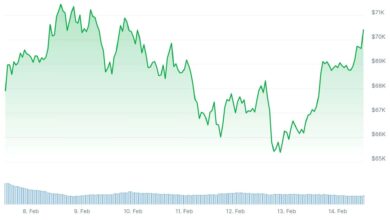
BNB Sees 65% Trading Volume Spike as Bulls Target $600 Breakout

Binance Coin (BNB) is commanding significant attention in the cryptocurrency market as BNB trading volume jumps 65%, signaling intensified trader interest around the crucial $600 price area. As of August 5, 2026, BNB price sits near $598.96, just below this psychological barrier that has proven challenging to overcome in recent weeks. The spike in trading activity reflects growing optimism among market participants, even as the broader cryptocurrency landscape remains cautious and volatile.
The surge in BNB volume is not occurring in isolation. Network fundamentals are strengthening, with BNB Chain processing approximately $19 billion in weekly decentralized exchange (DEX) volume, surpassing competitors like Ethereum and Solana. Additionally, network utilization has climbed from approximately 17% to nearly 30% in recent weeks, suggesting that increased on-chain activity is supporting the token’s price action. This combination of rising trading volumes and growing network engagement has prompted institutional and retail traders alike to reassess their positions around this critical $600 resistance level.
Understanding what’s driving this momentum requires examining the technical factors, market psychology, and BNB fundamentals that are converging to create this pivotal moment for the asset.
BNB Trading Volume Dynamics
Volume remains one of the most misunderstood yet critically important metrics in cryptocurrency trading. When traders observe BNB trading volume jumping by 65%, this indicates substantially more tokens are changing hands, which typically signals a shift in market sentiment or conviction behind price movements. Trading volume analysis helps distinguish between genuine breakouts and temporary price spikes without real support.
The recent surge in BNB volume is noteworthy because it occurred as the token broke above a descending trendline that had capped price action for approximately 45 days. This volume confirmation suggests that buyers possess meaningful conviction in the move, rather than passive price appreciation driven by few market participants. According to market data, trading volumes have jumped above the 14-day moving average, a technical signal that traders often use to gauge whether a breakout is likely to sustain.
However, it’s important to contextualize these volumes within BNB’s broader market structure. While trading volume has surged impressively in percentage terms, the absolute volume still represents approximately 1.7% of BNB’s total market capitalization—relatively thin compared to traditional assets. This means that despite the 65% increase, liquidity remains concentrated, and large trades can still move prices significantly in either direction.
The Technical Case for the $600 Level
Why $600 Matters
The $600 price level has emerged as perhaps the most important resistance zone for BNB over the past two months. This psychological and technical threshold has been tested multiple times since late June, when BNB briefly approached $598 before encountering selling pressure. Traders recognize round numbers like $600 as key levels where institutional orders, stop-losses, and technical resistance often cluster, making them natural points where price action tends to stall.
From a technical analysis perspective, the $600 level functions as a supply barrier where accumulated selling interest has consistently pushed price lower. Breaking and sustaining above $600 would represent a significant technical breakout, potentially clearing the way for a retest of the 200-day exponential moving average (EMA), which currently sits around $660. This would represent approximately 10% additional upside from current levels, offering an attractive risk-reward proposition for longer-term traders.
Support and Resistance Zones
Understanding the broader price structure around $600 reveals a complex technical picture. Below $600, the $580 level has recently proven itself as a critical support zone, with volume and RSI (Relative Strength Index) metrics suggesting that buyers are defending this region aggressively. The $560 to $570 area represents another important support cluster, where BNB found buyers after its extended downtrend from the mid-June highs around $632.
On the upside, $605 to $610 represents the next resistance cluster, where significant liquidity has accumulated. Successfully penetrating through this broader resistance zone would likely set the stage for a more substantial rally toward $650 to $680, a range that aligns with both Fibonacci retracement levels and prior market structure.
What’s Driving the Recent Volume Surge
Technical Positioning and the Breakout
The immediate catalyst for the 65% volume surge appears to be technical positioning. BNB price broke decisively above a descending trendline connecting lower highs that had constrained the asset since mid-June. This breakout triggered what technical analysts describe as a momentum confirmation, with the RSI (Relative Strength Index) climbing above 60, traditionally considered a buy signal indicating accelerating positive momentum.
When an asset breaks above a multi-week resistance level on strong volume, it often attracts fresh buying from traders who monitor technical breakouts. Additionally, traders with short positions (bets that the price would continue falling) may have been forced to cover their positions as the breakout unfolded, further amplifying the volume and price move.
Fundamental Strength on the BNB Chain
While technical indicators provide the immediate catalyst, BNB fundamentals are providing meaningful support for the rally. The BNB Chain ecosystem is demonstrating impressive network growth, with monthly transactions increasing from 424 million in February to approximately 480 million by June 2026. Daily gas consumption is also trending upward, reflecting sustained usage of the network for decentralized applications (dApps) and smart contract interactions.
The $19 billion in weekly DEX volume mentioned earlier is particularly significant because it demonstrates that BNB Chain is competing effectively with more established ecosystems. This network strength translates into genuine utility demand for BNB tokens, which users must hold to pay transaction fees on the network. Increased network activity creates structural demand for BNB, independent of speculative trading or short-term price movements.
Macroeconomic Context
The broader cryptocurrency market remains influenced by macroeconomic conditions, including interest rates, geopolitical tensions, and Federal Reserve policy. In late July and early August 2026, these factors remained challenging, with crude oil trading above $80 per barrel due to Middle East tensions, and market participants anticipating the Federal Reserve would raise rates by 25 basis points in September.
Despite this challenging macro backdrop, BNB has shown relative strength, suggesting that ecosystem fundamentals and technical positioning are offsetting broader market headwinds. This divergence between BNB’s strength and broader market caution is significant; it indicates that specialized demand for the token exists independent of sentiment toward cryptocurrencies generally.
Analyzing the 65% Volume Increase
Volume Metrics Explained
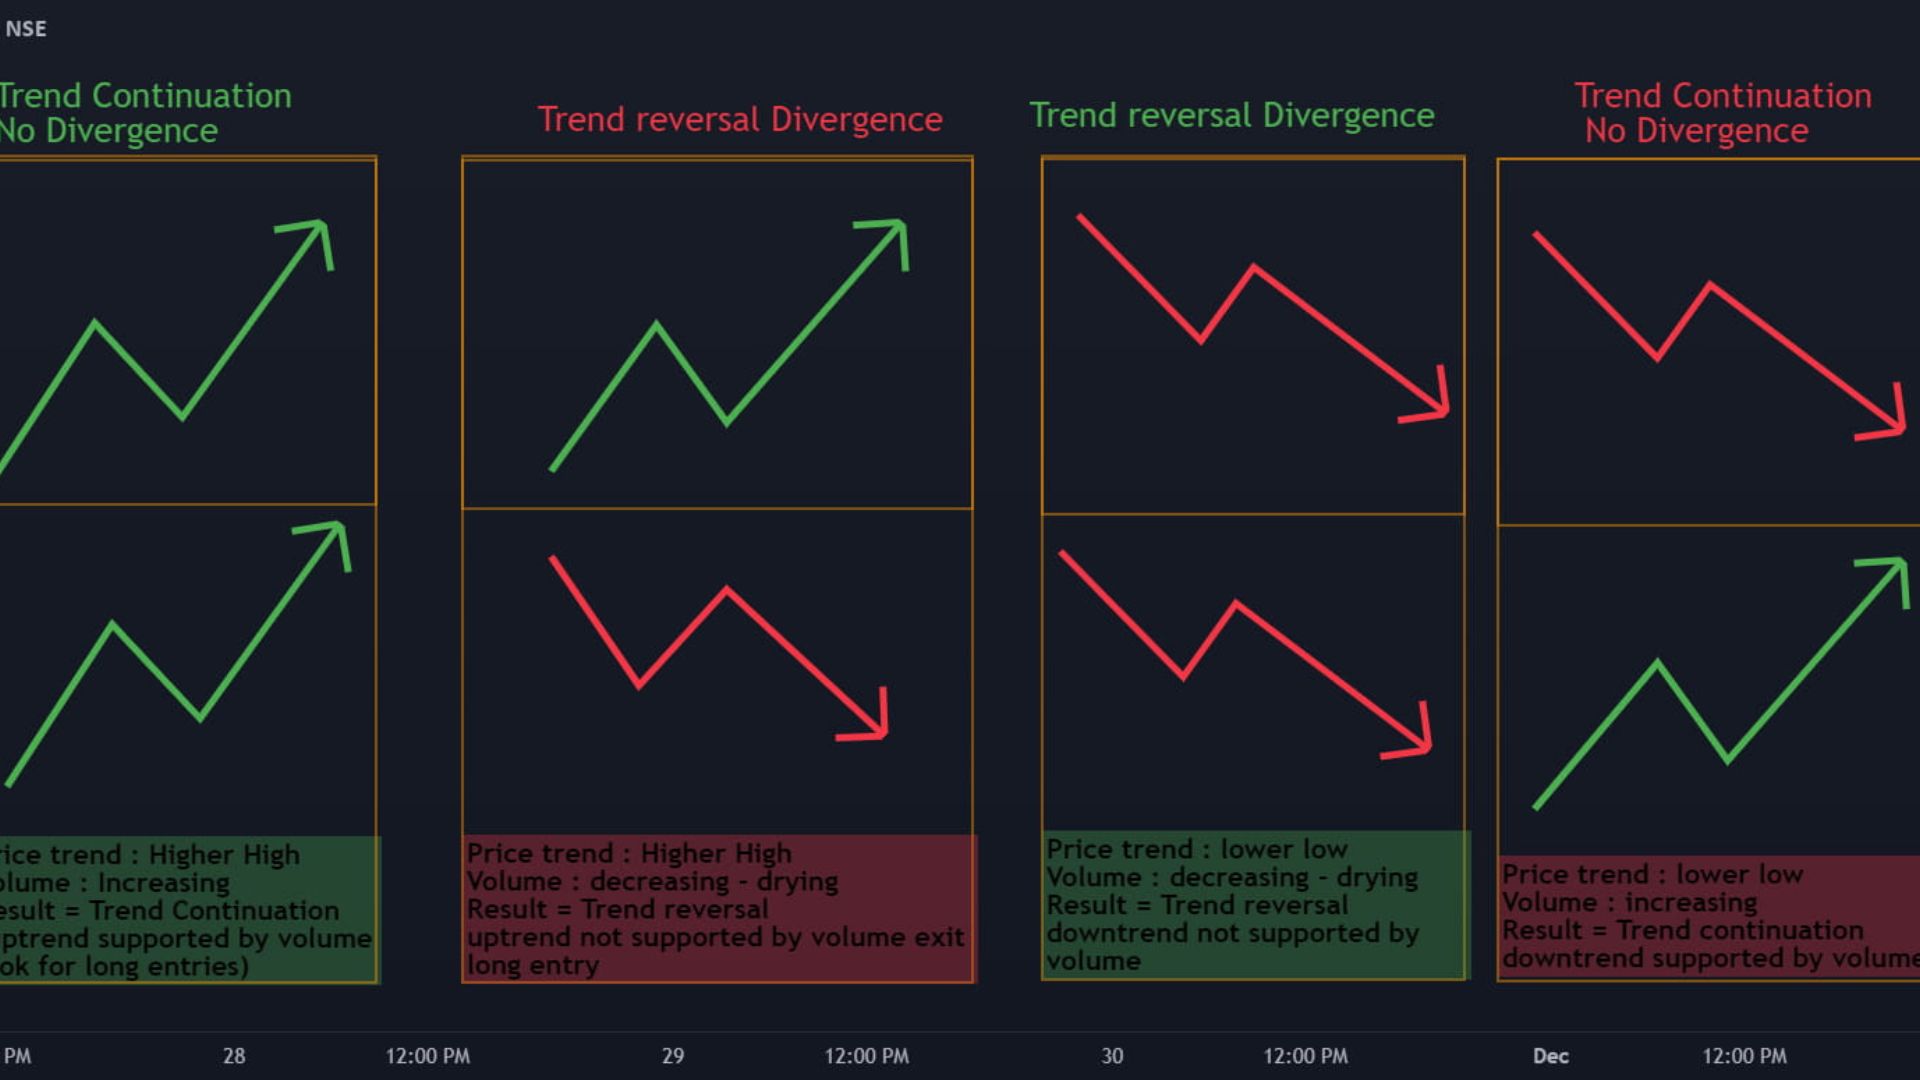
The 65% volume increase refers to the comparison between recent trading activity and historical averages. When BNB trading volume jumps this dramatically, it indicates that significantly more capital is flowing into or out of the asset compared to typical trading days. This metric is crucial for technical analysis because volume acts as a “confidence meter”—high volume during a price advance suggests conviction, while high volume during a decline suggests legitimate selling pressure.
Breaking down the volume dynamics, data shows that the bulk of the 65% increase occurred over a compressed timeframe—roughly 24-48 hours—as price moved decisively above the $580 resistance. This creates what traders call a volume-confirmed breakout, where both price movement and transaction volume align in the same direction, increasing the probability of follow-through.
Volume Relative to Market Cap
As noted earlier, while the percentage increase in volume has been dramatic, the absolute trading volume remains modest relative to BNB’s market capitalization of $79.7 billion. The 24-hour trading volume of approximately $1.1 billion represents about 1.4% of market cap. For comparison, major cryptocurrencies like Bitcoin and Ethereum typically see daily volumes representing 2-5% of their market cap on average.
This discrepancy suggests that the $600 level could present meaningful resistance, since breaking through it may require the volume to increase further to attract sufficient buying interest. Conversely, if volume remains elevated and price closes decisively above $600 on strong volume, it could signal that the market is prepared for a meaningful rally toward higher levels.
Market Sentiment and Trader Psychology
Fear and Greed in the Crypto Market
Market sentiment around cryptocurrency assets swings dramatically between extremes of fear and greed. In late July 2026, the Fear & Greed Index was hovering in the low-to-mid range, suggesting that while traders weren’t in panic mode, genuine optimism remained muted. This measured sentiment environment can be ideal for sustainable price rallies, as it prevents the kind of euphoric overextension that often precedes sharp corrections.
BNB traders appear to be testing whether the recent volume increase represents the beginning of a larger wave of buying interest or merely a tactical bounce within a broader downtrend. The psychology around the $600 level is particularly interesting: traders who missed earlier rallies may be waiting for a break above $600 to confirm the reversal before committing capital, which could create a self-reinforcing cycle of buying once price decisively takes out the level.
Order Book and Liquidity Clusters
Analysis of liquidity heatmaps reveals substantial order book concentration near specific price levels. Major liquidity clusters exist near $580 and $605-$610, creating what traders call a “**liquidity squeeze**.” As price approaches these zones, traders recognize that breaking through them requires meaningful volume to overcome accumulated buy and sell orders.
The fact that BNB price is now testing the lower bound of the $605-$610 liquidity cluster suggests we may be approaching a critical inflection point. If trading volume remains strong and price breaks above $610 on conviction, it could trigger a cascade of stop-loss orders placed by short-sellers, amplifying upside momentum. Conversely, if the asset fails to hold gains and retreats below $590, it could signal that the volume surge was merely a temporary tactical bounce.
Network Utilization and Real-World Utility
Growing Activity on BNB Chain
Beyond price and volume metrics, the growing network utilization on BNB Chain represents a fundamental factor supporting the token’s value proposition. Network utilization climbing from 17% to 30% over recent weeks is significant because it demonstrates that the blockchain is experiencing genuine increased adoption. More transactions and higher gas consumption create organic demand for BNB tokens, which users must hold to pay fees.
This is particularly important in distinguishing BNB from purely speculative tokens: there’s a use-case requirement driving demand. As the BNB Chain ecosystem expands with new dApps, DeFi protocols, and blockchain-based services, the base layer of demand for BNB strengthens, providing a floor for price even during periods of reduced speculative interest.
DEX Volume and Ecosystem Strength
The $19 billion in weekly DEX volume on BNB Chain is noteworthy in demonstrating that the ecosystem supports significant decentralized trading activity. This volume supports developers building on the chain, creating network effects that attract more applications and users. Integration of services like SilentSwap (enabling private cross-chain swaps) adds new utility to the ecosystem, potentially attracting new user cohorts.
Technical Indicators and Buy Signals
RSI and Momentum Confirmation
The Relative Strength Index (RSI), a momentum indicator, has crossed above 60 on the 4-hour timeframe, typically interpreted as a buy signal in technical analysis. The RSI measures the speed and magnitude of price changes on a scale of 0-100, with readings above 70 often indicating overbought conditions and readings below 30 indicating oversold conditions.
An RSI above 60 doesn’t guarantee further upside, but it does confirm that positive momentum is building. The RSI remains below the extreme overbought zone (70), suggesting there’s room for further appreciation before the asset becomes stretched on a momentum basis.
Moving Averages and Trend Direction
On the daily chart, BNB is currently trading above both its 50-day and 100-day simple moving averages, suggesting that the broader short-term trend has turned positive. The 200-day EMA sits around $660, above the current price, which means that sustained upside movement would need to clear this longer-term resistance to signal a meaningful trend reversal at higher timeframes.
The positioning of moving averages relative to price is crucial: when price trades above these exponential moving averages, they often act as dynamic support during pullbacks. If price pulls back from current levels, traders often watch for support at the 50-day moving average (currently around $575), before looking toward the 100-day average (approximately $560-565).
Risks to the Current Bullish Setup
Risk of Rejection at $600
While the technical setup appears encouraging, the repeated failures at $600 over the past six weeks represent real risk. If BNB price can’t decisively break above $600 on strong volume, it could signal that resistance remains too formidable, potentially leading to a pullback toward $580 or lower support levels. Rejection at $600 would likely occur on elevated volume, creating a bearish reversal pattern that could spark selling.
Macroeconomic Headwinds
The broader cryptocurrency market remains vulnerable to external shocks. Geopolitical tensions in the Middle East, uncertainty around Federal Reserve policy, and potential banking sector stress could all trigger selling pressure that affects BNB alongside other crypto assets. An unexpected negative macroeconomic development could quickly erase the recent gains.
Liquidity Concerns
While trading volume has increased 65%, the absolute liquidity relative to BNB’s market cap remains thin. This means that a sudden shift in market sentiment could result in sharper price moves than would occur in a traditional asset with deeper order books. Large traders or institutions suddenly entering or exiting positions could cause significant volatility.
What Should Traders Watch for Moving Forward
Support levels to monitor include $590, $580, and the $560-570 zone. If price retreats below $570 on strong volume, it would likely invalidate the current bullish setup and suggest that the volume surge was merely a temporary tactical bounce.
Resistance levels include $600 (the current focal point), $605-610 (the next liquidity cluster), and $630-640 (a level BNB traded near in mid-June before the extended downtrend).
Traders should also monitor BNB Chain fundamentals, particularly network utilization rates and transaction volumes. If on-chain activity continues to expand while price remains stalled around $600, it could create accumulation opportunities for longer-term investors who believe BNB fundamentals justify higher valuations.
Conclusion
The 65% surge in BNB trading volume occurring as the cryptocurrency tests the critical $600 resistance level represents a pivotal moment for the token. The combination of technical breakout, volume confirmation, strengthening BNB Chain fundamentals, and increased network utilization creates a scenario where further upside appears possible. However, the repeated tests of $600 over six weeks serve as a cautionary reminder that breaking this resistance will require sustained buying interest and continued strong trading volume.
BNB traders face a classic technical decision point: either the $600 level proves to be the beginning of a meaningful rally toward $650-680, or it continues to function as formidable resistance that caps further appreciation. The outcome will largely depend on whether the current volume surge reflects genuine renewed interest in the asset or merely tactical positioning by short-term traders. For investors focused on BNB’s utility within the expanding BNB Chain ecosystem, the current price action offers an interesting risk-reward setup around this critical $600 level, though careful risk management remains essential given the volatile nature of cryptocurrency markets.