Crypto Price Analysis: ETH, XRP, ADA, BNB & HYPE
Crypto price analysis for ETH, XRP, ADA, BNB, and HYPE, covering market trends, support, resistance, momentum, and key levels to watch.
Cryptocurrency markets are entering another important phase as traders balance renewed optimism with persistent volatility. Bitcoin’s recovery has helped improve sentiment across the wider digital asset market, but altcoins are not moving uniformly. Some tokens are attempting to reclaim lost support levels, while others remain trapped in broad ranges or are showing signs of relative strength.
This crypto price analysis examines Ethereum, XRP, Cardano, BNB, and Hyperliquid’s HYPE token. These five assets represent different areas of the market: smart-contract infrastructure, payments, proof-of-stake development, exchange utility, and decentralized derivatives trading. Their price structures therefore offer a useful snapshot of the current altcoin environment.
Recent market data places Ethereum near $2,281, BNB near $644, and XRP near $1.16. Ethereum and BNB remain more than 50% below their recorded all-time highs, while XRP is more than 68% below its peak. This illustrates how sharply the market has repriced many major assets despite occasional rallies.
Technical analysis should not be treated as a guarantee of future performance. Instead, support and resistance zones help traders organize possible scenarios. A sustained move above resistance can signal improving demand, while a breakdown below support may indicate that sellers are regaining control. Volume, market-wide liquidity, Bitcoin’s direction, and macroeconomic conditions remain essential factors in interpreting each chart.
Ethereum Price Analysis
Ethereum remains the largest smart-contract blockchain by market capitalization and one of the most closely watched assets in every crypto price analysis. ETH is influenced by activity in decentralized finance, stablecoins, non-fungible tokens, layer-2 networks, staking, and institutional investment products.
Recent price action has placed Ethereum close to a major decision area. The asset has been trading around the $2,250–$2,300 region, following a sharp recovery as Bitcoin moved higher. The rebound demonstrates that buyers are still willing to defend Ethereum after periods of weakness, but the broader chart remains fragile because ETH is still substantially below its all-time high of approximately $4,946.
ETH support and resistance levels
The first important support zone for Ethereum is located around $2,000–$2,100. This area has previously attracted buyers and could become the foundation for a broader recovery if selling pressure remains limited. A move below $2,000 would weaken the short-term structure and could expose lower levels near $1,800.
On the upside, Ethereum must establish acceptance above $2,400 before the market can confidently describe the current move as a trend reversal. A successful breakout would suggest that buyers are overcoming overhead supply created by traders who purchased at higher prices and are now trying to exit at breakeven.
If ETH breaks above $2,400 with rising volume, the next potential target could be the $2,600–$2,800 region. That area would likely attract profit-taking because it represents a significant recovery from recent lows. Conversely, rejection near resistance followed by a fall under $2,000 would restore the bearish argument.
Ethereum fundamentals and market outlook
Ethereum’s long-term investment case continues to depend on network usage and the ability of its scaling ecosystem to expand without weakening demand for ETH. Layer-2 activity can improve transaction capacity, but investors also monitor whether that activity translates into sustainable value for Ethereum itself.
Staking remains another important factor. Locked ETH can reduce immediately available supply, although staking rewards, validator withdrawals, and changing market conditions can affect the balance between supply and demand. Institutional flows are also becoming increasingly relevant. Recent reporting indicated strong inflows into ether investment products during a broad crypto rally. The near-term Ethereum outlook is cautiously constructive above $2,000 but decisively bullish only after a confirmed break above $2,400. Traders should watch whether rallies are supported by spot buying or driven mainly by short liquidations. A rally fueled by forced buying can be powerful, but it may also reverse quickly once the liquidation event ends.
XRP Price Analysis
XRP has a distinctive market profile because its price is shaped not only by chart structure and broader altcoin sentiment but also by developments involving Ripple, payment networks, regulation, and institutional adoption. XRP is often highly reactive to legal or policy-related headlines, making risk management particularly important.
The token has recently traded near $1.16 and remains well below its all-time high of roughly $3.65. This large distance from the peak shows that XRP has not yet regained the long-term momentum it achieved during previous speculative cycles.
XRP technical structure
The $1.00–$1.20 region is the most important support area for XRP. Holding above $1 would help preserve the possibility of a gradual recovery, while a decisive breakdown could create a psychological shift among traders. Once a round-number level turns into resistance, market participants often become more cautious.
A stronger recovery would require XRP to reclaim the $1.50–$1.60 range. Earlier analysis identified $1.50 as an area where sellers had rejected price and pointed to $1.60 as a key resistance level. A breakout above that zone, particularly if accompanied by expanding volume, would improve the medium-term outlook.
If XRP cannot hold $1, the next downside areas could be around $0.80 and $0.70. These are not guaranteed targets, but they represent reasonable zones where buyers might attempt to re-enter. The market would likely become increasingly bearish if XRP formed a series of lower highs while trading below $1.
XRP adoption and investor sentiment
The central bullish argument for XRP is its potential role in cross-border payments and liquidity provision. Supporters believe that faster settlement and lower transaction costs could create long-term utility. However, utility narratives must eventually be supported by measurable network activity, sustained demand, and favorable regulatory conditions.
XRP also tends to attract substantial retail interest. This can create strong upward moves when sentiment improves, but it can also increase volatility during market-wide selloffs. Traders should therefore distinguish between a headline-driven spike and a technically confirmed trend.
For XRP, the current crypto market outlook depends heavily on whether the token can maintain the $1 level and later break through $1.50–$1.60. Until that happens, the chart is better described as a recovery attempt inside a larger period of uncertainty rather than a confirmed bullish reversal.
Cardano Price Analysis
Cardano’s ADA token remains one of the most discussed assets in the blockchain sector. Its ecosystem emphasizes peer-reviewed development, proof-of-stake consensus, governance, and gradual protocol upgrades. ADA has a large and committed community, but price performance depends on whether network development produces sustained usage and economic activity.
Earlier market analysis showed ADA testing the $0.24 area after failing to break above $0.28. The token had moved sideways for months, creating a narrow range between buyer support and seller resistance. More recent market commentary identified $0.15 as another critical support area, demonstrating how quickly the chart’s key levels can shift during a prolonged downtrend.
ADA support and resistance
For Cardano, support should be viewed as a zone rather than a precise price. The $0.15–$0.20 region is important because a sustained hold could encourage accumulation, while a breakdown could open the door to new lows. If ADA remains below $0.20, the market may continue to treat rallies as temporary relief moves.
On the upside, ADA must first recover $0.20 and then challenge $0.24–$0.28. The $0.28 area previously rejected buyers, making it a natural test for any new rally. A close above $0.28 with strong volume would offer evidence that demand is improving and that the long period of sideways trading may be ending.
A bullish breakout would be more credible if ADA also produced higher lows on the daily chart. A single upward candle is not enough to confirm a trend change. Traders generally look for a sequence of higher highs, higher lows, increasing volume, and continued strength during market pullbacks.
Cardano fundamentals

Cardano’s long-term case is tied to developer activity, decentralized applications, governance, and real-world adoption. Its methodical development process can appeal to investors who value formal research and careful upgrades, although that approach may appear slow compared with faster-moving competitors.
The principal risk is that technological progress does not translate into enough user demand. In a competitive smart-contract market, blockchains must attract developers, liquidity, applications, and users. If those metrics remain weak, ADA may struggle to outperform even when the wider market rallies.
The ADA outlook is therefore highly dependent on confirmation. Holding above $0.15 would prevent further technical deterioration, but a move above $0.24 and ultimately $0.28 would be needed to create a more convincing bullish structure. Until then, Cardano remains a high-volatility asset trading near major long-term support.
BNB Price Analysis
BNB is the native asset of the BNB Chain ecosystem and has additional utility within the Binance exchange environment. Its price is influenced by exchange activity, chain usage, token burns, decentralized applications, regulatory developments, and the overall condition of the crypto market.
Current market data places BNB near $644, while its all-time high is approximately $1,370. That leaves the token around 53% below its peak. Despite the distance from its high, BNB has shown greater relative stability than many smaller altcoins.
BNB trading range
BNB has been locked in a broad range with support near $580 and resistance around $690. Previous attempts to move above $690 were rejected, indicating that sellers remain active in that area.
A breakout above $690 would be an important technical development. If buyers can hold the token above that level, the market could begin targeting $720, $760, and eventually higher resistance zones. The strength of the breakout would depend on trading volume and whether the price remains above the former resistance after the initial move.
On the downside, $580 is the key level to monitor. A break beneath it could expose BNB to a decline toward $500. That scenario would suggest that the long consolidation phase is resolving lower rather than higher.
BNB fundamentals and risks
BNB benefits from a large user base and a broad ecosystem. The BNB Chain hosts decentralized finance protocols, gaming applications, stablecoin activity, and other blockchain services. Its connection with one of the world’s largest cryptocurrency exchanges also provides substantial liquidity and visibility.
However, that connection creates regulatory and concentration risks. Investors must consider the impact that exchange-related legal developments, restrictions, or changes in user activity could have on sentiment. BNB’s central role in the ecosystem can be a strength during expansion but a vulnerability during periods of uncertainty.
The BNB forecast remains neutral to cautiously bullish while the token holds above $580. A sustained break above $690 would shift momentum in favor of buyers, while a fall under $580 would invalidate the range-bound recovery thesis and increase the probability of a move toward $500.
HYPE Price Analysis
Hyperliquid’s HYPE token has emerged as one of the most impressive performers among newer large-cap crypto assets. HYPE is connected to the Hyperliquid decentralized derivatives ecosystem, where users trade perpetual contracts and other products. The token’s performance has benefited from interest in decentralized exchanges, on-chain trading, and the platform’s rapid growth.
Earlier analysis reported that HYPE rallied approximately 30% in one week and reached a new record near $62.50 after breaking above $43. Support was identified around $52 following the advance. Separate market reporting also noted that HYPE rose sharply amid attention surrounding the possibility of bringing Hyperliquid’s perpetual-futures platform into the United States under federal rules.
HYPE momentum and price levels
HYPE currently represents a different technical setup from ETH, XRP, ADA, and BNB. While several major altcoins remain far below their previous peaks, HYPE has demonstrated strong relative strength and a willingness to make new highs.
The first support area after a strong rally is generally the previous breakout region. For HYPE, the $52 zone is significant because it was identified as a possible area where buyers could defend the trend. If the token holds above that level, the market may attempt to retest its highs and establish fresh price discovery.
A deeper pullback would not automatically destroy the bullish structure. Fast-moving assets often retrace sharply after reaching record levels. The important question is whether HYPE forms a higher low or falls back below the breakout level near $43. A move under $43 would weaken the trend and suggest that the previous breakout was not sustainable.
Hyperliquid adoption and valuation
The bullish case for HYPE is linked to platform usage, trading volume, fees, liquidity, and the broader shift toward decentralized financial infrastructure. If Hyperliquid continues to attract traders, the token may benefit from increased visibility and stronger ecosystem demand.
The main risk is that its rapid appreciation may have created an overheated market. High momentum attracts traders seeking quick gains, but it also increases the likelihood of abrupt profit-taking. HYPE holders should monitor funding rates, open interest, liquidation levels, and daily trading volume rather than relying only on price.
Among the five assets in this crypto price analysis, HYPE has shown the strongest momentum, but it may also carry the highest pullback risk. Strong performance does not eliminate volatility; it often magnifies it.
Comparing the Five Crypto Assets
Ethereum offers the most established smart-contract exposure, with its outlook tied to network activity, staking, scaling, and institutional demand. XRP has a more specialized payments narrative and remains highly sensitive to regulation and legal developments. Cardano is a development-focused blockchain whose valuation depends on converting technical progress into measurable adoption.
BNB combines exchange utility with smart-chain activity and has been trading inside a clearly defined range. HYPE provides exposure to decentralized derivatives and has shown exceptional momentum, although its shorter market history makes valuation and volatility more difficult to assess.
The current market structure suggests that traders should avoid treating all altcoins as identical. A rising Bitcoin price can lift the entire market temporarily, but lasting outperformance usually depends on each project’s liquidity, fundamentals, token economics, and investor demand. Recent reports described a broad rally in which large short positions were liquidated, helping push major crypto assets higher. Such events can accelerate gains but may also create unstable conditions.
Key Factors That Could Influence Prices
The direction of Bitcoin remains the most important external influence. When Bitcoin rises steadily, capital often rotates into large-cap altcoins and then into smaller tokens. If Bitcoin experiences a sharp correction, however, altcoins can decline much more quickly.
Liquidity and interest rates also matter. Crypto assets generally benefit from improving risk appetite and easier financial conditions. Conversely, stronger yields on traditional assets or concerns about inflation can reduce demand for speculative investments.
Regulation is another major catalyst. Clearer rules could help established networks attract institutions, while restrictive policies could reduce liquidity and exchange access. XRP and BNB may be especially sensitive to regulatory headlines, while HYPE could be affected by rules governing decentralized derivatives.
Finally, traders should monitor volume and market breadth. If only a small number of tokens are rising while most of the market remains weak, the rally may lack durability. A healthier market typically shows broad participation, improving liquidity, and repeated successful retests of former resistance.
Crypto Price Analysis: Bullish and Bearish Scenarios
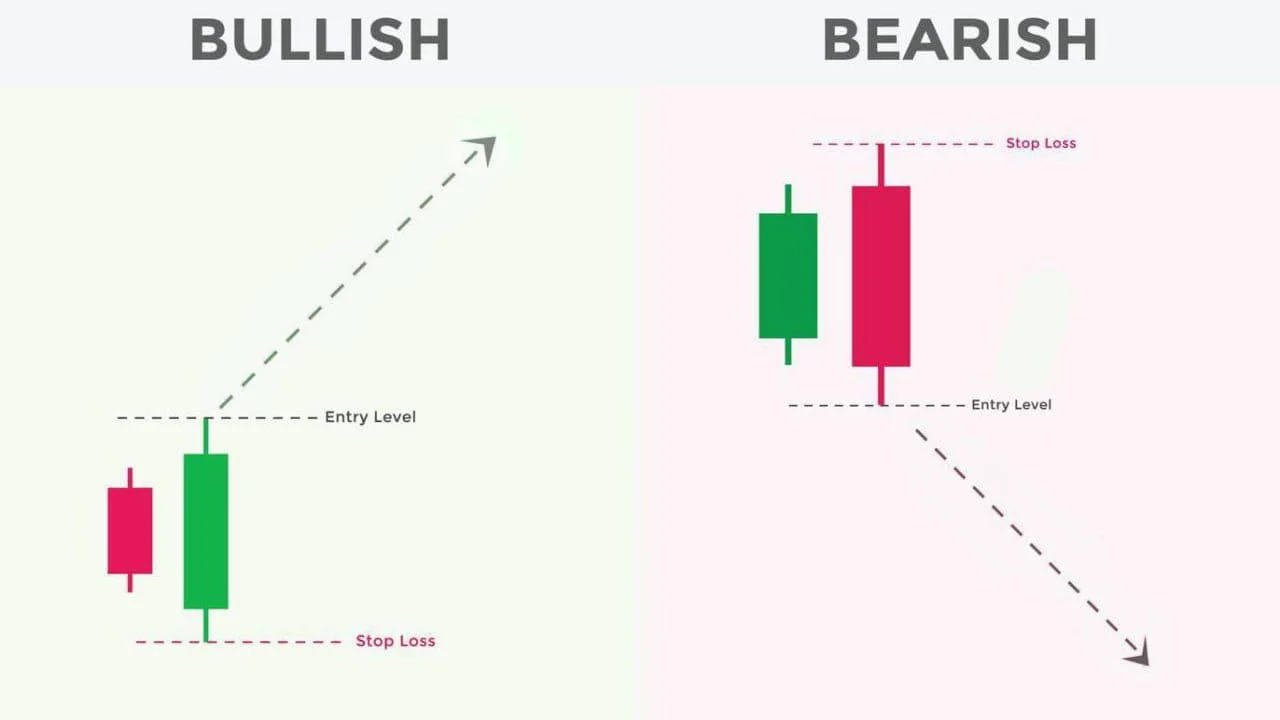
In a bullish scenario, Bitcoin maintains its recovery, liquidity expands, and investors rotate into major altcoins. Ethereum could reclaim $2,400, XRP could challenge $1.50–$1.60, ADA could recover $0.24–$0.28, and BNB could break above $690. HYPE would remain in price discovery if it continues to hold its breakout structure.
In a bearish scenario, Bitcoin loses momentum and risk appetite declines. Ethereum could fall below $2,000, XRP could lose $1, ADA could break below $0.15–$0.20, and BNB could drop under $580. HYPE might experience a deeper correction toward $43 or lower if momentum traders begin taking profits.
A neutral scenario would involve continued range trading. This could allow projects with strong fundamentals to build a base, but it could also frustrate traders who expect immediate breakouts. In such an environment, confirmation is more valuable than prediction. Waiting for a daily or weekly close beyond key levels may reduce the risk of reacting to temporary wicks.
Conclusion
This crypto price analysis shows five very different market structures. Ethereum is attempting to recover while facing resistance near $2,400. XRP must defend the psychological $1 area and reclaim higher resistance before a trend reversal becomes credible. Cardano remains vulnerable near long-term support but could improve if it recovers $0.24–$0.28. BNB is trapped between approximately $580 and $690, making those boundaries especially important. HYPE has displayed the strongest momentum but also carries meaningful pullback risk after its rapid advance.
The most reliable approach is to combine technical levels with fundamental research, market-wide trends, volume, and disciplined risk management. No single support or resistance level guarantees a result, and cryptocurrency prices can change rapidly. Investors should size positions carefully and avoid making decisions based solely on short-term excitement.
FAQs
Q1. Which cryptocurrency has the strongest momentum?
HYPE has shown the strongest recent momentum among the five assets discussed. It recorded a sharp rally and reached a new high near $62.50 in earlier analysis. However, strong momentum can lead to equally sharp corrections, so traders should watch whether the token holds important breakout levels.
Q2. Is Ethereum bullish above $2,000?
Ethereum holding above $2,000 would preserve a constructive short-term outlook, but it would not by itself confirm a full bullish reversal. ETH would need to reclaim resistance near $2,400 and establish higher highs and higher lows before the broader trend could be considered significantly stronger.
Q3. What is the most important XRP price level?
The $1 level is the most important psychological support for XRP. Holding above it could allow the token to consolidate and attempt a recovery. A decisive move below $1 could increase selling pressure, while a move above $1.50–$1.60 would improve the medium-term technical outlook.
Q4. Can Cardano recover from its current weakness?
Cardano can recover if buyers defend support, trading volume improves, and the token reclaims key resistance levels. A recovery above $0.24 and then $0.28 would provide stronger evidence of renewed demand. Until that happens, ADA remains vulnerable to additional volatility.
Q5. Is BNB a safer altcoin than HYPE?
BNB generally has a longer operating history, deeper liquidity, and broader ecosystem utility than HYPE. HYPE, however, has shown stronger recent growth. Neither asset is risk-free. BNB faces exchange and regulatory risks, while HYPE faces higher volatility and the uncertainty associated with a newer market narrative.